Wednesday, October 24, 2018

MySQL Cluster 7.6.8 performance jump of up to 240%

In February I added a new feature to my Sysbench version that I use in
my MySQL Cluster testing. This new feature adds a new column in the
table called filter. It contains the same value as the primary key.

With this new column I can easily change the range scan queries in
sysbench from returning 100 rows to instead scan 100 rows and
return 1 row. This means that sysbench can benchmark the filtering
performance of the underlying database engine.

Next I ran tests where set the number of rows in the range to
10.000 rows. This new test was a perfect vehicle to improve performance
in NDB for scan filtering.

Filtering one row in 7.6.7 in this sysbench tests costs about 750 ns.

When I started out optimising these 750 ns of time I didn't expect so
much improvement, but using perf it was possible to get very
fine-grained pinpointing of the wasted CPU performance. One
interesting thing was that I found a bitmask that had zeroing of the
bitmask in the constructor, it turned out that this constructor was
called twice in filtering a row and neither of them was required.
So fixing this simple thing removed about 20 ns of CPU usage and
in this case about 3-4% performance improvement.

As you can see this is micro-optimisations and for those perf is a
splendid tool.

One of the biggest reasons for bad performance in modern software
applications is instruction cache misses. Most modern software
is packed with features and this requires a lot of code to handle.
The compiler has a hard time knowing which code is the common
path and which path is the error handling path.

In the MySQL code we have two macro's likely and unlikely that
can hint the compiler what code path to optimise for.

In this code path I was optimising I found that I had roughly 1 billion
instruction cache misses over a short period (20 seconds if I remember
correctly). I managed with numerous changes to decrease the number
of instruction cache misses to 100 million in the same amount of time.

I also found some simple fixes that cut away a third of the processing time.

In the end I found myself looking at the cost being brought down to around
250ns. So comparing the performance of this scan filtering with 7.5.10 we
have optimised this particular code path by 240%.

During the development of these improvements of scan filtering, I discovered
that some of the optimisations could be applied also to searching in our
ordered indexes. The impact of this is that the index rebuild phase of a restart
will go faster, I haven't measured the exact impact this has yet. It also means
that any application using ordered indexes will go a lot faster.

For example performance of a standard Sysbench OLTP RW benchmark
with one added ordered index column improves by 70% in 7.6.8
compared to earlier versions of 7.6 and 7.5.

Monday, September 10, 2018

Non-blocking Two-phase commit in NDB Cluster

Non-blocking 2PC protocol

Many of the new DBMSs developed in the last 10 years have abandoned the
two-phase commit protocol and instead relied on replication protocols.

One of the main reasons for this has been the notion that two-phase commit
protocol is a blocking protocol. This is true for the classic version of the
two-phase commit protocol.

When NDB Cluster was developed in the 1990s we had requirements that
the replication protocol could not be blocking. A competitor at the time,
ClustRa, solved this by using a backup transaction coordinator. Given that
NDB Cluster had requirements to survive multiple simultaneous node failures,
this wasn't sufficient.

Thus a new two-phase commit protocol was developed that is completely
non-blocking. The main idea is that one uses a take-over protocol, this means
that any number of nodes can crash and we can still handle it as long as there
is enough nodes to keep all data available.

In addition NDB Cluster is designed both for Disk Durable transactions
and Network Durable transactions. Disk Durable transactions requires
data to be durable on disk when the transaction have committed and
Network Durable requires that the transaction is on at least 2 computers
when the transaction is committed.

Due to the response time requirements for applications that NDB Cluster
was designed for, we implemented it such that when applications received
the response the transaction was Network Durable.

The Disk Durability is handled in a background phase where data is
consistently flushed to disk such that we can always recover a consistent
version of the data even in the presence of a complete failure of the
cluster.

This part is handled by the Global Checkpoint protocol. The PDF above
describes the transaction protocol and the global checkpoint protocol that
together implement the Network Durability and Disk Durability of NDB
Cluster.

Thursday, September 06, 2018

Basics of MySQL Cluster

Basics of MySQL Cluster

This PDF introduces the basic architecture of MySQL Cluster and how to
access it with various APIs.

Friday, August 24, 2018

Manual for benchmark toolset dbt2-0.37.50.15

Manual for dbt2-0.37.50.15

My career has been focused on two important aspects of DBMSs. The
first is the recovery algorithms to enable the DBMS to never be down.
The second is efficient execution of OLTP in the DBMS.

When I started a short career as a consultant in 2006 I noted that I had
to spend more and more time setting up and tearing down NDB Clusters
to perform benchmarks.

The particular benchmark I started developing was DBT2. I downloaded
the dbt2-0.37 version. I quickly noted that it was very hard to run a
benchmark in this version in an automated manner.

My long-term goal was to achieve a scenario where an entire benchmark
could be executed with only command. This goal took several years to
achieve and many versions of this new dbt2-0.37 tree.

Since I automated more and more, the scripts I developed are layered
such that I have base scripts that execute start and stop of individual
nodes. On top of this script I have another script that can start and
stop a cluster of nodes. In addition I have a set of scripts that execute
benchmarks. On top of all those scripts I have a script that executes
the entire thing.

The dbt2-0.37.50 tree also fixed one bug in the benchmark execution and
ensured that I could handle hundreds of thousands of transactions per second
and still handle the statistics in the benchmark.

Later I also added support for executing Sysbench and flexAsynch. Sysbench
support was added by forking sysbench-0.4.12 and fixing some scalability
issues in the benchmark and added support for continuous updates of
performance (defaults to one report per 3 seconds).

Today I view the dbt2-0.37.50 tree and sysbench-0.4.12 as my toolbox.
It would be quite time consuming to analyse any new features from a
performance point of view without this tool. This means that I think
it is worthwhile to continue developing this toolset for my own purposes.

About 10 years ago we decided to make this toolset publically available
at the MySQL website. One reason for this was to ensure that anyone
that wants to replicate the benchmarks that I report on my blog is able to
do this.

Currently my focus is on developing MySQL Cluster and thus the focus
on the development of this toolset is centered around these 3 benchmarks
with NDB. But the benchmark scripts still support running Sysbench and
DBT2 for InnoDB as well. I used to develop InnoDB performance
improvements as well for a few years (and MySQL server improvements)
and this toolset was equally important at that time.

When I wrote my book I decided to write a chapter to document this
toolset. This chapter of my book is really helpful to myself. It is easy
to forget some detail of how to use it.

Above is a link to the PDF file of this chapter if anyone wants to
try out and use these benchmark toolsets.

My last set of benchmark blogs on benchmarks of MySQL Cluster
in the Oracle Cloud used these benchmark scripts.

The toolset is not intended for production setups of NDB, but I am
sure it can be used for this with some adaption of the scripts.

For development setups of MySQL Cluster we are developing
MySQL Cluster Configurator (MCC) sometimes called
Auto Installer.

For production setups of NDB we are developing MySQL Cluster
Manager (MCM).

Happy benchmarking :)

Monday, August 20, 2018

Use cases for MySQL Cluster

Third chapter of "MySQL Cluster 7.5 inside and out".

NDB was designed for a number of networking applications. In particular the original
design focused a lot on telecom applications. The telecom applications have extreme
requirements on availability, many networking applications as well.

This chapter goes through a number of application types where NDB have been used
and also uses a number of public examples of use cases.

These application types include DNS servers, DHCP servers, Intelligent Network (IN)
applications, 3G/4G/5G applications, RADIUS servers, number portability, DIAMETER
server, Video-on-demand applications, Payment Gateways, Software Defined
Networking (SDN), Network Function Virtualization (NFV), Voice over IP.

In addition also many internet applications such as Gaming servers, financial
applications such as stock quote servers, whitelist/blacklist handling. eCommerce
applications, payment services, web applications, fraud detection, online banking,
session database.

In addition a number of frameworks have used NDB and presented it publically such
as a GE presentation, HopsFS (Hadoop distribution), HopsYARN, Oracle OpenStack
and OpenLDAP.

With the possibility to handle more data in MySQL Cluster 7.6 it is likely that this
list of application types will grow even more.

Friday, August 17, 2018

Rationale for MySQL Cluster

Second chapter of "MySQL Cluster 7.5 inside and out".

When I started developing the ideas for NDB Cluster in my Ph.D studies
about 25 years ago, the first thing I did was to perform a very thorough
study of the requirements.

At that time I participated in a European Research for UMTS. UMTS was
later marketed as 3G. My part of this big study group of more than 100
researchers was to simulate the network behaviour. We used the
protocols developed by other groups to see what the load would be on
the various nodes in the telecom network.

I was mostly interested in the load it contributed to the network databases.
Through these studies and also by studying the AXE system developed
in Ericsson I got a very good picture of the requirements on a DBMS
to be used for future telecom services.

In parallel with this I also studied a number of other areas such as
multimedia email servers, news-on-demand servers, genealogy
servers that would be other popular services in the telecom network.

In the above chapter I go through how those requirements was turned
into requirements on predictable response times, availability requirements,
throughput requirements and so forth.

In particular how the requirement led to a model that divided the Data
Server functionality (NDB data nodes) and the Query Server
functionality (MySQL Server nodes).

Also how predictable response times are achieved by building on ideas
from the AXE architecture developed in Ericsson.

Thursday, August 16, 2018

What is special with MySQL Cluster

The first chapter from the book "MySQL Cluster 7.5 inside and out".
This chapter presents a number of key features that makes NDB
unique.

Thursday, August 09, 2018

Optimising scan filter for checkpoints in NDB

When loading massive amounts of data into NDB when testing the new
adaptive checkpoint speed I noted that checkpoints slowed down as the
database size grew.

I could note in debug logs that the amount of checkpoint writes was
dropping significantly at times. After some investigation I discovered
the root cause.

The checkpoint algorithm in NDB requires all changed rows to be written
to the checkpoint even if it is not a part that is fully checkpointed.
This means that each row has to be scanned to discover if it has been
written.

When loading 600 GByte of DBT2 data we have more than two billion rows
in the database. Scanning two billion rows takes around 15-20 seconds
when simultaneously handling lots of inserts.

This slowed down checkpoints and in addition it uses a lot of CPU.
Thus we wanted a more efficient scanning algorithm in this case.

The solution is based on dividing the database into larger segments.
When updating a row, one has to ensure that a flag on the larger
segment is also updated. A simple first approach is to implement
this on page level for our fixed size pages. Every row has an entry
in the fixed size. This part contains the row header and all fixed
size columns that are not defined as using DYNAMIC storage.

In DBT2 this means that most fixed size pages have around 300 row
entries. Thus we can check one page and if no row has been changed
we can skip checking 300 row entries.

When data size grows to TBytes and we checkpoint every 10-20 seconds,
the risk of a row in a page being updated is actually fairly low.
Thus this simple optimisation brings down the slowdown of the
checkpoints to small parts of a second.

Obviously it is possible to use smaller regions and also larger regions
to control this if required.

This is an important improvement of the checkpointing in
MySQL Cluster 7.6.7.

Scheduling challenges of checkpoints in NDB

The NDB data nodes are implemented using asynchronous programming. The model is
quite simple. One can send asynchronous messages on two priority levels, the
A-level is high priority messages that are mainly used for various management
actions. The B-level represents the normal priority level where all normal
messages handling transactions are executed.

It is also possible to send delayed signals that will wait for a certain
number of milliseconds before being delivered to the receiver.

When developing MySQL Cluster 7.4 we noted a problem with local checkpoints. If
transaction load was extremely high, the checkpoints almost stopped. If such a
situation stays for too long, we will run out of REDO log.

To handle this we introduced a special version of delayed signals. This new
signal will be scheduled such that at most around 75 messages are executed
before this message is delivered. There can be thousands of messages waiting
in queue, so this gives a higher priority to this signal type.

This feature was used to get control of checkpoint execution and introduced in
MySQL Cluster 7.4.7. With this feature each LDM thread will at least be able
to deliver 10 MBytes of checkpoint writes per second.

With the introduction of adaptive checkpoint speed this wasn't enough. In a
situation where we load data into NDB Cluster we might need to write much
more data to the checkpoints.

To solve this we keep track of how much data we need to write per second to
ensure that we don't run out of REDO log.

If the REDO log comes to a critical point where the risk of running out of
REDO log is high, we will raise priority of checkpointing even higher such
that we can ensure that we don't run out of REDO log.

This means that during a critical situation, normal transaction throughput
will decrease since we will put a lot of effort into ensuring that we don't
get into a situation of a complete stop due to running out of REDO log.

We solve this by executing checkpoint scans without real-time breaks for a
number of rows and if we need to continue writing checkpoints we send a
message on A-level to ourself to continue without giving transactions a
chance to come in. When we written enough we will give the transactions a
chance again by sending the new special delayed signal.

The challenge that we get here is that checkpoints must be prioritised over
normal transactions in many situations. At the same time we want the
prioritisation to be smooth to avoid start and stop situations that can
easily cause ripple effects in a large cluster.

This improved scheduling of checkpoints was one part of the solution to
the adaptive checkpoint speed that is introduced in MySQL Cluster 7.6.7.

Wednesday, August 08, 2018

Loading data into TByte sized NDB data nodes

One of the main design goals with MySQL Cluster 7.6 was to
support much larger data sets in each data node. The
checkpoint algorithm makes it hard to manage data nodes in
7.5 and earlier versions with many hundreds of GBytes of
data. Using MySQL Cluster 7.6.7 the algorithms scale to
multiple TBytes per data node.

However the largest machines currently at my disposal have
1 TByte of RAM. Thus I went about testing to load data into
a cluster on two such machines. There is no comparison to
older version, it is possible to load data into earlier
versions, but it is not very practical with such large
data nodes in earlier versions.

7.6.7 comes with both partial checkpoints and adaptive
control of disk write speed. This means that we can load
terabytes of data into the cluster even with moderately
sized REDO logs.

To experiment with these I used the same test as in the
previous blog.

Here is the setup.

2 data nodes, one per machine where each machine is equipped
with 1 TByte of RAM, 60 CPU cores distributed on 4 CPU sockets.

The NDB configuration used 750 GByte of DataMemory, 8 LDM threads,
the data node only used CPUs from one CPU socket. It was essential
to set Numa=1 in the configuration to be able to use memory from
all four CPU sockets.

We used the default setup for MinDiskWriteSpeed and MaxDiskWriteSpeed*
configuration parameters. The REDO log size was 2 GByte per LDM thread.
We thus set the following REDO log parameters:
NoOfFragmentLogParts=8 (equal to number of LDM threads)
NoOfFragmentLogFiles=8
FragmentLogFileSize=256M

To enable the new algorithm for adaptive disk write speed it is
necessary to set EnableRedoControl=1 in configuration.

Interestingly in loading the data we were limited by the disk read
bandwidth of the disk where the CSV files of DBT2 were stored. We also
went ahead and created one CSV file per table using SELECT INTO OUTFILE
and used ndb_import to load data into NDB. Using ndb_import we were able
to load data faster than using LOAD DATA INFILE since we were then able
to use files stored on RAID:ed SSD drives.

One challenge with loading data through DBT2 is that we are using warehouse
id as the partition key. This means that all loads from one CSV file goes
into one LDM thread. This means that the load among the LDM threads isn't
balanced. This complicates the checkpointing scheme a bit. We ensure that
any REDO log part that becomes critical also ensures that all other LDM
threads in the cluster knows that we are in a critical state.

Loading through ndb_import is thus easier since the load is balanced over
the LDM threads.

With 8 LDM threads we load 1-2 warehouses per second and one warehouse is
around 100 MByte of data spread into about 370k rows.

In this test we loaded 6000 DBT2 warehouses, thus around 600 GByte in
database size.

The restart is completely similar to the recovery when loading 600 warehouses.
Touching the memory now takes a bit longer, it takes 4 minutes and 44 seconds
plus another 28 seconds when starting the first recovery phases.

The restore phase took 27 minutes and 40 seconds, the REDO phase was still less
than a second and finally rebuilding the ordered indexes took 12 minutes and
13 seconds.

The copy fragment increased to 17 seconds since we needed to scan more data
this time. The phase waiting for checkpoints to complete was still 5 seconds
and the phase that waited for replication subscriptions to be configured also
took 5 seconds. This is usually around 5-6 seconds unless a MySQL server is
down when it can take up to 2 minutes before this phase is completed.

Total restart time thus became 45 minutes and 32 seconds.

As we can see we can recover a TByte sized data node within an hour and this is
with 8 LDM threads. If we instead use 24 LDM threads the restore and rebuild
index phase will go about 3 times faster and thus we would cut restart time by
another 25 minutes and thus restart time would be about 20 minutes in this case
and we would even be able to restart more than 2 TBytes within an hour.

Analysis of restart improvements in MySQL Cluster 7.6.7

To test restart times I am using the DBT2 test suite that
I developed based on DBT2 0.37 since 2006.

The following test setup is used:
DataMemory: 100 GByte (90 Gbyte in 7.5 and earlier)
IndexMemory: 10 GByte in 7.5 and earlier versions)
NoOfFragmentLogParts=8
NoOfFragmentLogFiles=50
FragmentLogFileSize=256M
MinDiskWriteSpeed=20M (two times the default)
MaxDiskWriteSpeed=40M (two times the default)

I load the database using LOAD DATA FROM INFILE with
precreated CSV files that contains the data for one
warehouse and table. This means that there are 8 CSV
files per warehouse. I load 600 warehouses into NDB.
This means a database size of around 60 GByte with
around 280 million rows.

Next I run the DBT2 from 2 MySQL servers using 16 threads
each for two minutes. This creates a load of almost
100k TPM.

The next step is to restart one of the 2 data nodes and
measure the time it takes to restart the data node.

Obviously an even more realistic benchmark would be to
restart while running the benchmark, but the effect on
the restart analysis would not be substantial.

I tested using the latest GA versions from 7.4 and 7.5
and also both 7.6 GA versions (7.6.6 and 7.6.7).

First the results:
7.4.21: 31 minutes 29 seconds
7.5.11: 44 minutes 9 seconds
7.6.6:  18 minutes 2 seconds
7.6.7:  4 minutes 45 seconds

In order to understand better these numbers we will look
at the most important restart phases and analyse numbers
there.

It takes about 3 seconds to stop a node and start it again.
This time is constant in all versions.

The next step is allocating memory and touching the memory.
Allocating memory doesn't actually commit the memory to RAM.
It only ensures that there is space in RAM or in swap file
allocated for the memory. So in order to commit the memory
to RAM, it is necessary to touch the memory (read or write
from it). The speed of this touching of memory is fairly
constant and depends on Linux version (slight speedup in
newer Linux versions). My measurements shows that this
touching of memory handles about 2.5-3.5 GByte of memory
per second. Thus the restart time is dependent on the
DataMemory size and other memory consuming parts of the
NDB data node.

NDB data nodes always allocate and commit all the memory
as part of the restart. It is even possible to lock the
memory to RAM through setting LockPagesInMemory to 1 in
the configuration.

This step takes 26 seconds for all versions.

A major step in the recovery is to recreate the database that
was in the data node at the time of the node stop. This is
performed in 3 phases.

1) Restore data from a checkpoint
2) Execute REDO log
3) Rebuild ordered indexes

The time of all these phases are dependent on the version.
In 7.3 and earlier versions there was also a lot of time
spent waiting for the metadata lock when copying the
metadata to the starting node. This meant waiting for the
current checkpoint to complete (a checkpoint in 7.3 with
these settings and the database size takes about 20 minutes).

Thus 7.3 would add approximately 10 minutes to the restart times.

After restoring the local database from disk the next major
phase is the synchronisation phase. This phase will take longer
time if there has been updates during the restart. The time spent
in this phase is not expected to have changed in any material
fashion in 7.6.

The final phase is to wait for one checkpoint to complete to
ensure that the node is recoverable even if the other node
should fail completely.

Restore phase in 7.4.21 and 7.5.11 only takes about 5-10 seconds.
The reason is that the last checkpoint completed happened early
in the load phase. Thus almost the entire database has to be
loaded from the REDO log.

The numbers on the restore phase plus the REDO phase is
3 minutes and 48 seconds in 7.4.21 and 3 minutes and 30 seconds
in 7.5.11.

In 7.6.6 the restore phase takes considerably longer and thus
the REDO phase is shortened. 7.6.6 makes partial checkpoints and
can thus write checkpoints a bit faster. But the disk write speed
is too slow to keep up with the insert rate. Actually setting
the MaxDiskWriteSpeed to 100M in 7.6.6 speeds up restarts by a
factor of 3. The time for the restore phase in 7.6.6 is
1 minute and 12 seconds and the REDO phase is 2 minutes and
20 seconds. Thus the total time of these two phases are
3 minutes and 32 seconds.

So what we can conclude here is that 7.6.6 requires a higher
setting of the disk write speed to materially improve the
restart times in these two phases for restarts during massive
inserts.

Now the restore phase in 7.6.7 recovers almost all the data
since checkpoints are executed with 15-20 seconds intervals.
The restore phase consumes 2 minutes and 48 seconds and the
REDO phase takes less than one second. The speed up of these
two comes from that the restore phase is faster per row
compared to executing the REDO log although more data has to
be restored in 7.6.

Next we analyse the phase that rebuilds the ordered indexes.
The change here actually comes from configuration changes and
the ability to lock the index build threads to more CPUs.

In 7.6 we changed the default of BuildIndexThreads to 128.
This means that each fragment that requires rebuild of an
index for a table can be executed in parallel. The default
in 7.5 and earlier meant that all rebuild of indexes happened
in LDM threads. Thus in this case the 7.5 and 7.4 versions
could use 8 CPUs to rebuild indexes while 7.6 could use
16 CPUs to rebuild indexes. The parallelisation of
rebuild indexes can happen in 7.5, but 7.6 ensures that we
lock to more CPUs compared in 7.5.

This change meant that the times of 7.4.21 (2 minutes
19 seconds) and 7.5.11 (2 minutes 12 seconds) was significantly
improved. In 7.6.6 the time was 1 minutes 20 seconds and in
7.6.7 1 minutes and 19 seconds. Thus a significant improvement
of this phase in 7.6.

The synchronisation phase takes 1-2 seconds in all versions.
Since no changes happened during the restart this second is spent
in scanning the 280 million rows to see if any changes have
occurred during the restart (happens in live node).

Now we come to the phase where the big change in 7.6.6 happened
and where it happens even more in 7.6.7. This phase is where
we wait for a checkpoint to complete that we participated in.

Actually this means first waiting for the ongoing checkpoint to
complete and next to participate in another checkpoint.

The time to execute a checkpoint is fairly constant in 7.5 and
earlier versions. In this particular setup it takes about 22
minutes. This means that this wait phase can take anywhere
between 22 minutes and 44 minutes dependent on the timing of
the restart.

This is the reason why 7.4.21 restarted so much faster than
7.5.11. It was pure luck in timing the checkpoints.

In 7.6.6 the time to execute checkpoints is much lower compared
to in 7.5. Thus this phase is much shorter here. However the time
for a checkpoint varies dependent on how much changes have happened
since the last checkpoint. In this particular case the phase took
12 minutes and 26 seconds.

With 7.6.7 we adapt checkpoint speed to ensure that we can
survive even with very small REDO logs. The second reason
for this is to make checkpoints much faster. During execution of
this benchmark no checkpoints took more than 25 seconds and most
of them took about 15-20 seconds and when the DBT2 benchmark
executed it took about 10-15 seconds. In idle mode a checkpoint
is executed within a few seconds.

This means that waiting for a checkpoint to complete and execute
a new one is very fast. In this benchmark it took only 5 seconds.

Thus in this particular restarts of 7.6.7 was almost 10 times
faster compared to 7.4 and 7.5 and even 4 times faster than
restarts of 7.6.6.

Thus most of the restart times are now linearly dependent on the
database size and the size of the ordered indexes.

There are more phases in NDB restarts that can consume time, for
instance with disk data we have to UNDO disk data changes. This
phase was improved 5 times with 4 LDM threads in 7.6. There
are also various steps where occasionally the restart can be blocked
due to metadata locks and other reasons.

More automated control in MySQL Cluster 7.6.7

Apart from bug fixes the 7.6.7 version of MySQL Cluster also brings
a major improvement of restart times through adaptively controlling
checkpoint speed.

Many DBMSs work hard on automating management of the database nodes.
In NDB automated management was a design point from the very first
version. This means that nodes crash and restart without operator
assistance.

For the last years we have also worked on developing algorithms that
require less configuration. This will greatly simplify the configuration
of NDB Cluster.

In 7.6.7 we have made it much easier to configure handling of checkpoints
(LCPs) and REDO logging.

In earlier versions of NDB the checkpoint speed has been controlled by
two things. The first is based on the following configuration variables:

MinDiskWriteSpeed: This is the minimum disk write speed we will attempt
to write during a checkpoint even in the presence of CPU overload and
disk overload. This defaults to 10 MByte per second, this is the sum
on all LDM threads, thus on the entire data node.

MaxDiskWriteSpeed: This is the maximum disk write speed we will attempt
to write during a checkpoint, if no CPU overload or disk overload is
seen, this is the checkpoint speed that will be used in normal operation.
Defaults to 20 MByte per second.

MaxDiskWriteSpeedOtherNodeRestart: This is the maximum disk write speed
we will write during a checkpoint when another node is restarting. It
defaults to 50 MByte per second.

MaxDiskWriteSpeedOwnNodeRestart: This is the maximum disk write speed
we will write during a checkpoint when our node is restarting. It defaults to
200 MByte per second.

The actual disk write speed achieved is using those configuration variables
in combination with an adaptive algorithm that will decrease the checkpoint
speed when the CPU or the disk is overloaded.

These parameters exists also in 7.6.7, but there is very little reason to
change them from their default value if the new configuration variable
EnableRedoControl is set to 1. By default this variable is set to 0 to
avoid changes of behaviour in a GA released version of MySQL Cluster.

In earlier versions of NDB it was necessary to have very large REDO logs.
The reason is that earlier versions (7.5 and earlier) wrote the entire
database to disk in each checkpoint. This meant that checkpoints during
massive inserts got larger and larger and to ensure successful insertion
of the entire data set it was necessary to have REDO logs that was about
twice the size of the DataMemory.

Now in 7.6.7 it should be quite enough to have 2-4 GByte of REDO log per
REDO log part (normally equal to the number of LDM threads). This REDO
log size works perfectly even when loading TBytes of data into NDB.
Remember that EnableRedoControl needs to be set to 1 for this to work.

Thus in MySQL Cluster 7.6.7 one can simplify the configuration of REDO logs
and checkpointing.

In earlier versions we need to set the following variables:
NoOfFragmentLogParts (always set equal to number of LDM threads)
NoOfFragmentLogFiles
FragmentLogFileSize
MinDiskWriteSpeed
MaxDiskWriteSpeed
MaxDiskWriteSpeedOtherNodeRestart
MaxDiskWriteSpeedOwnNodeRestart

The product of NoOfFragmentLogParts, NoOfFragmentLogFiles and
FragmentLogFileSize is the size of the REDO log. In earlier versions
this product should be roughly two times the setting of DataMemory.

The default setting of FragmentLogFileSize is 16 MByte. Personally I always
increase this setting to 256 MByte (set to 256M).

So e.g. with a DataMemory of 100 GByte and 8 LDM threads one can set those to
NoOfFragmentLogParts=8
NoOfFragmentLogFiles=50
FragmentLogFileSize=256M

This gives a REDO log size of 200 GByte.

The setting of disk write speed will be discussed a bit more in a coming blog.

In 7.6.7 one can instead configure as follows.

EnableRedoControl=1
NoOfFragmentLogParts=8
NoOfFragmentLogFiles=8
FragmentLogFileSize=256M

The setting of disk write speed variables need not be considered. The setting
of NoOfFragmentLogFiles to 8 and FragmentLogFileSize to 256M should work for
almost all setups of NDB. Only when dealing with data nodes larger than
one terabyte could it be considered to increase the REDO log size. The
NoOfFragmentLogParts should still be set to the number of LDM threads.

Thus in 7.6.7 a lot less thought has to go into configuration of REDO logs
and disk write speeds. Disk write speed still affects backup write speeds
as well though, so it could be a good idea to consider how fast you want to
write your backups using the variables MinDiskWriteSpeed and MaxDiskWriteSpeed.

The reason that disk write speeds for checkpoints is less important to consider
is that we calculate how fast we need to write the checkpoints based on the
write activity in NDB. This means that when setting EnableRedoControl the write
speed to the disk can be quite substantial. So this setting will not work very
well unless the disk subsystem is able to handle the load. The disk subsystem
should be able to handle around 100 MByte of disk writes per LDM thread.

With modern HW this should not be an issue, in particular not when using NVMe
drives. In our benchmarking we are using a RAID 0 setup of 6 SSD drives. With
8 LDM threads inserting at full speed we use about 50% of the disk bandwidth
in this case (500 MByte per second).

Friday, July 06, 2018

Articles on setting up highly available DNS/DHCP servers using MySQL Cluster

I found this old article that shows how to setup
highly available DNS/DHCP servers using MySQL Cluster.

It uses 4 machines with 4 replicas, it describes how to do it with MySQL Cluster 7.3,
obviously today it would make more sense to use 7.5 or 7.6. In this case an extension
would be add ndb_read_backup=on to my.cnf to ensure that all MySQL servers in the
clusters reads the local copy rather than going over the network to read from another
replica.

Another tool that I found and discussed in my book on MySQL Cluster that uses
NDB for DNS and DHCP is Kea, here is an article describing how to setup Kea using NDB.

Wednesday, June 13, 2018

Node restart improvements in MySQL Cluster 7.6

A simple test to see how much faster restarts are in 7.6 compared to 7.5 is to
load a set of DBT2 warehouses and next perform a node restart of one of the
data nodes.

In the test we load 600 warehouses, this means about 60 GByte of data inserted
into NDB in each data node.

A node restart of 7.5.10 using this data set takes 19 minutes and 11 seconds.
In 7.6.6 this restart takes 6 minutes and 49 seconds.

The difference can vary, especially since the restart time in 7.5 has a fairly high
variance. The restart time in 7.6.6 has much smaller variance.

We will look into the different restart phases and see how those are affected.

The first phase is to allocate the memory and ensure that the memory is allocated
to our process by touching the memory. This phase roughly allocates 2.7 GByte
per second. In this case it takes 26 seconds in both 7.5 and in 7.6.

After that we have some preparatory steps, these normally are very quick and in
this takes about 1-2 seconds. These steps involve preparing the metadata to use
in the restart.

The next step is the restore phase where we recover data from a local checkpoint.
Given the introduction of Partial LCP in 7.6 this phase actually takes longer time
since there is some duplication in the restore where one row is restored multiple
times. This phase will go faster through setting RecoveryWork to a smaller
number, but this will instead increase work on checkpointing during normal
operation.

In this test 7.5 took 1 minute and 51 seconds to restore and 7.6.6 used 2 minutes
and 15 seconds.

The next phase is the REDO log execution phase. Since partial LCP means that
LCPs are shorter, this phase is shortened. This particular benchmark actually
doesn't shorten as much as could be the case since there is heavy insert activity
right before the restart. But it still decreased from 51 seconds in 7.5 to 35 seconds
in 7.6.

After this we execute the UNDO log, this particular benchmark has no disk data.
So both 7.5 and 7.6 takes no time in this phase. But this phase has improved by
5 times with 4 LDM threads and this benchmark uses 8 LDM threads. So this
phase is dramatically faster in 7.6 if used.

The next phase is the rebuilding of the ordered indexes. This phase executes the
same code as in 7.5, but we have changed default configuration to ensure that
the rebuild use fully parallelised rebuild. This means that we have 16 CPUs
working on the rebuild instead of 8 CPUs as in 7.5. This gives a rebuild time
of 1 minute and 17 seconds in 7.6.6 compared to 2 minutes and 4 seconds. The
reason it isn't twice is since we make use of hyperthreading to speed things up.

The copy fragment phase is more or less empty in both 7.5 and 7.6 since we
didn't perform any updates during the restart. We don't expect any major
differences in this phase between 7.5 and 7.6.

Next we come to biggest gain in restart times in 7.6. This is the phase where
we wait for the local checkpoint to complete. In 7.5 we have to wait between
1 and 2 checkpoint times. In 7.5 in this benchmark the checkpoint takes about
11 minutes although we have increased the disk write speed compared to the
default. In this execution 7.5 took 13 minutes and 48 seconds in this phase.

In 7.6 we execute a checkpoint that is local to the starting node. This takes
2 minutes and 4 seconds. Finally we participate in a checkpoint where all
nodes participate. This is now extremely fast, it takes only 4 seconds since
no activity is ongoing. So the total time for this phase 2 minutes and 8 seconds.

This wait for checkpoint phase is fairly constant in time in 7.6, in 7.5 it grows
with a growing database size and is dependent on the disk write speed we have
configured. Thus the gain in restart time in 7.6 is a bit variable, but this
experiment have been done with fairly conservative numbers.

The final restart phase is handing over the responsibility of event handling
between connected MySQL servers, this phase takes 5-6 seconds in both
7.5 and 7.6. It can take longer if some MySQL Server is down during the
restart.

As can be seen we have significantly brought down the restart times for a
size that is common in 7.5, with larger sizes the difference is much bigger.

Tuesday, June 12, 2018

Benchmark of new cloud feature in MySQL Cluster 7.6


In previous blogs we have shown how MySQL Cluster can use the Read Backup
feature to improve performance when the MySQL Server and the NDB data
node are colocated.

There are two scenarios in a cloud setup where additional measures are
needed to ensure localized read accesses even when using the Read Backup
feature.

The first scenario is when data nodes and MySQL Servers are not colocated.
In this case by default we have no notion of closeness between nodes in
the cluster.

The second case is when we have multiple node groups and using colocated
data nodes and MySQL Server. In this case we have a notion of closeness
to the data in the node group we are colocated with, but not to other
node groups.

In a cloud setup the closeness is dependent on whether two nodes are in
the same availability domain (availability zone in Amazon/Google) or not.
In your own network other scenarios could exist.

In MySQL Cluster 7.6 we added a new feature where it is possible
to configure nodes to be contained in a certain location domain.
Nodes that are close to each other should be configured to be part of
the same location domain. Nodes belonging to different location domains
are always considered to be further away than the one with the same
location domain.

We will use this knowledge to always use a transaction coordinator placed
in the same location domain and if possible we will always read from a
replica placed in the same location domain as the transaction coordinator.

We use this feature to direct reads to a replica that is contained
in the same availability domain.

This provides a much better throughput for read queries in MySQL Cluster
when the data nodes and MySQL servers span multiple availability domains.

In the figure below we see the setup, each sysbench application is working
against one MySQL Server, both of these are located in the same availability
domain. The MySQL Server works against a set of 3 replicas in the NDB data
nodes. Each of those 3 replicas reside in a different availabilty domain.

The graph above shows the difference between using location domain ids in
this setup compared to not using them. The lacking measurements is missing
simply because there wasn't enough time to complete this particular
benchmark, but the measurements show still the improvements possible and
the improvement is above 40%.

The Bare Metal Server used for data nodes was the DenseIO2 machines and
the MySQL Server used a bare metal server without any attached disks and
not even any block storage is needed in the MySQL Server instances. The
MySQL Servers in an NDB setup are more or stateless, all the required state
is available in the NDB data nodes. Thus it is quite ok to start up a MySQL
Server from scratch all the time. The exception is when the MySQL Server
is used for replicating to another cluster, in this case the binlog state is required
to be persistent on the MySQL Server.

Monday, June 11, 2018

Impact of sharding on query performance in MySQL Cluster


A new week of blogs about our development in MySQL Cluster 7.6.
After working a long time on a set of new developments, there is a lot
of things to describe. I will continue this week with discussing sharding
and NDB, a new cloud feature in 7.6 and provide some benchmark
results on restart performance in 7.6 compared to 7.5. I am also planning
a comparative analysis for a few more versions of NDB.

In the blog serie I have presented recently we have displayed
the performance impact of various new features in MySQL Cluster
7.5 and 7.6. All these benchmarks were executed with tables that
used 1 partition. The idea behind this is that to develop a
scalable application it is important to develop partition-aware
applications.

A partition-aware application will ensure that all partitions
except one is pruned away from the query. Thus they get the same
performance as a query on a single-partition table.

Now in this blog we analyse the difference on using 1 partition
per table and using 8 partitions per table.

The execution difference is that with 8 partitions we have to
dive into the tree 8 times instead of one time and we have to
take the startup cost of the scan as well. At the same time
using 8 partitions means that we get some amount of parallelism
in the query execution and this speeds up query execution during
low concurrency.

Thus there are two main difference with single-partition scans
and multi-partition scans.

The first difference is that the parallelism decreases the latency
of query execution at low concurrency. More partitions means a higher
speedup.

The second difference is that the data node will spend more CPU to
execute the query for multi-partition scans compared to single-partition
scans.

Most of the benchmarks I have shown are limited by the cluster connection
used. Thus we haven't focused so much on the CPU usage in data nodes.

Thus in the graph above the improvement of query speed is around 20% at
low concurrency. The performance difference for other concurrency levels
is small, the multi-partition scans uses more CPU. The multi-partition
scans is though a bit more variable in its throughput.

Tests where I focused more on data node performance showed around 10%
overhead for multi-partition scans compared to single-partition scans
in a similar setup.

An interesting observation is that although most of the applications
should be developed with partition-aware queries, those queries that
are not pruned to one partition will be automatically parallelised.

This is the advantage of the MySQL Cluster auto-sharded architecture.
In a sharded setup using any other DBMS it is necessary to ensure that
all queries are performed in only one shard since there are no automatic
queries over many shards. This means that partition-aware queries will
be ok to handle in only one data server, but the application will have to
calculate where this data server resides. Cross-shard queries have to be
automatically managed though, both sending queries in parallel to
many shards and merging the results from many shards.

With NDB all of this is automatic. If the query is partition-aware,
it will be automatically directed to the correct shard (node group
in NDB). If the query isn't partition-aware and thus a cross-shard
query, it is automatically parallelised. It is even possible to
push join queries down into the NDB data nodes to execute the
join queries using a parallel linked-join algorithm.

As we have shown in earlier blogs and will show even more in coming
blogs NDB using the Read Backup feature will ensure that read queries
are directed to a data node that is as local as possible to the MySQL
Server executing the query. This is true also for join queries being pushed
down to the NDB data nodes.

Friday, June 08, 2018

Benchmark Read Backup Feature of NDB in the Oracle Cloud


The previous blog demonstrated the improvements from using the Read Backup
feature in NDB in a tightly connected on premise installation. Now we will
show how the performance is impacted when running on the Oracle cloud.

In both benchmarks we show here the MySQL Server and the NDB data node
are colocated and we have one node group where the combined data nodes
and MySQL Servers are placed in their own availability domain. We use all
3 availability domains and thus we have 3 synchronous replicas of the
data in the database. This means that all communication between data nodes
and all communication not using the local data node from the MySQL server
will also communicate  to another availability domain.

The below figure shows the mapping of processes to cloud machines. In this
experiment we used the DenseIO2 Bare Metal Server as machines for the
combined data node, MySQL server and place to run the Sysbench application.
This machine has 52 CPU cores, it has a set of NVMe drives that provide a
very fast local storage for the NDB data nodes, this ensures very speedy
recovery and in addition provides an excellent hardware to place some columns
in the disk data parts of NDB. The machine has 768 GByte of memory and
51.2 TByte of NVMe drives. Thus providing  a highly available in-memory
storage of around 500 GByte and a few TBytes of disk data columns.


We used a standard Sysbench OLTP RO benchmark. This benchmark executes 16
SQL queries, 10 simple primary key lookups, 4 range scan queries that gets
100 rows from the database and finally a BEGIN and a COMMIT statement.
To scale the Sysbench benchmark each Sysbench instance uses different tables
and different data. In a real setting there would likely be a load balancer
that directs connections to an application in one of the availability
domains. From this application the idea is to handle most traffic internally
in the same availability domain. My benchmark scripts are ensuring that the
different sysbench programs are started in a synchronous manner.

Thus the main difference when Sysbench is replaced by a real application
is that a load balancer sits in front of the application. Load balancers
are provided as a service in the Oracle Cloud. One could also use a
MySQL Router between the application and the MySQL Server. The JDBC
driver can handle failover between MySQL Servers, this would avoid this
extra network jump. As we will see in the benchmarks, each network jump
makes it harder to get the optimal performance out of the setup and it
increases the latency of application responses.

The graph at the top of the blog shows the results when running all
nodes colocated in the same server. There is some variation on results
at low concurrency, but as the randomness of query placement goes away
the improvement of using the Read Backup feature is stable around 50%.
This improvement comes mostly from avoiding the latency when going over
to another availability domain for queries where the primary replica
is not in the same availability domain.

At extremely high concurrency the impact decreases, but at the same
time when running with more than 2k concurrent connections the
response time is a not so good anymore, at low concurrency each
transaction has a latency of around 2.5 milliseconds. At 2304
connections the latency has increased to 35 milliseconds. This is still
pretty good given that each transaction has 16 SQL queries to execute.

In the next benchmark we move the sysbench application to its own set
of machines. For the Sysbench application we used a VM2.16 instance
that has 16 CPU cores (thus 32 CPUs). The image below shows the
placement of the processes in the machines and availability domains
of the Oracle Cloud.


The graph below shows the performance numbers in this setup. In this
setup the difference between using Read Backup or not is smaller since
we introduce one more latency, we have two network jumps between servers
in the same availability domain for each SQL query. This increases the
latency of each transaction by almost a factor of 2. Thus the difference
becomes smaller between the read backup feature and not using it. In this
setup the difference is around 30%.


Some things to note about latency between servers in the Oracle Cloud and
obviously in any cloud installation is that the latency between servers
can differ. This is natural since the speed of light is a factor in the
latency and thus the latency between servers in the cloud is varying
dependent on how far apart availability domains are and the placement of
the used servers. The experienced latency numbers were a lot better though
than the ones promised in the marketing. Thus most applications will
be able to handle their latency requirements in the Oracle Cloud.

An interesting thing to note is that when running applications that use
a lot of network resources, it is important to configure the Linux networking
correctly. Interestingly I had some issues with this in the last benchmark
where the sysbench VMs could not deliver more than 40k TPS at first. After
searching around for the bottleneck I found it to be in the Linux interrupts
on the Sysbench VM. CPU 30 and 31 were completely busy. I was able to
issue a few Linux commands and immediately the performance jumped up to
70k transactions when the soft interrupt part was moved to CPU 0 through
CPU 15 using RPS in Linux. I described this in an earlier blog and also
my book on MySQL Cluster 7.5 contains a chapter discussing those configuration
options in Linux.

In a later blog I will describe exactly what I did to setup those benchmarks.
This means that it will be possible to replicate these benchmarks for anyone
with an Oracle Cloud account. This is one of the cool features of a cloud
installation that it makes it possible to replicate any benchmark setups.

Thursday, June 07, 2018

Benchmarking the Read Backup feature in the NDB storage engine

Read Backup was a new feature in MySQL Cluster 7.5. When MySQL
Cluster 7.5 was released I was already busily engaged in working
on the partial LCP feature we now released in 7.6. So I had not
much time producing benchmarks showing the impact of the
Read Backup feature.

Read Backup means that committed reads in NDB can use the backup
replicas as well. In NDB tables reads are already directed towards
the primary replica. The reason is that MySQL Cluster wants to
ensure that applications can trust that a reader can see his own
updates. Many modern NoSQL DBMSs lack this feature since they are
using eventual replication and a very flexible scheduling of which
replicas to read. NDB provides a stronger consistency guarantee
in that all applications can see their own updates and replication
is synchronous.

The reason that reading using a backup replica can fail to see its own
changes in NDB is that we release the locks on the primary replica first,
next we deliver the committed message to the application and last
we release the locks on the backup. This means that reading a
backup replica using committed read (reads the latest committed row without
locks) can only be guaranteed to see its own updates if it reads the
primary replica.

With tables that have the Read Backup feature we will delay the
sending of the committed message to the application until all rows
have been unlocked. This means that we can safely read any replica
for those tables and still see our own updates.

Setting the Read Backup feature for a table can either be set through
a special syntax using the COMMENT in the CREATE TABLE statement. A
much easier and likely more useful approach is to set the
ndb_read_backup configuration variable in the MySQL Server to 1. This
means that all tables in this MySQL Server will be created with the
Read Backup feature. Similarly there is a similar feature for ensuring
that all tables are created with the fully replicated feature. In this
case the configuration variable ndb_fully_replicated is set to 1. In
MySQL Cluster 7.6 none of these configuration variables are enabled by
default. But for SQL applications it is a good to always enable the
read backup feature and for applications that focus on read scalability
with fairly limited size of the data, the fully replicated feature can
also be enabled.

Fully replicated tables have a replica in each data node and any replica
can be read for committed reads.

The benchmark we present here is performed in a setup with the optimal
network architecture. It is two machines where the MySQL Server and the
NDB data node can be colocated and the network between the nodes is
using an Infiniband network. This means that in most every real case the
impact of using read backup in a colocated scenario is even bigger.

In this scenario the extra delay to go over the network is fairly small,
thus the impact of low concurrency is fairly small, but the extra overhead
of going over the network a lot shows its impact on higher concurrency and
grows all the way up to 30%.

MySQL Cluster 7.6 and the thread pool

Looking at the graphs in the previous blog post one can see that
MySQL Cluster 7.6 using the shared memory transporter can improve
performance at very high thread counts by more than 100%. Still
the performance is still dropping fairly significantly moving from
512 to 1536 threads. The MySQL Server using the NDB transporter
scales very well on all sorts of architectures and using very many
cores. But I have noted that when the number of connections goes
beyond some limit (in my benchmarks usually around 512 threads),
the performance starts to drop.

Actually in the commercial version of MySQL Cluster help is available
to resolve this problem. The thread pool was developed by me and a team
of performance experts to ensure that MySQL using InnoDB would have
the same performance even with massive amounts of threads hitting at the
MySQL server. It still works for this purpose. I have never mentioned
the use of thread pool for MySQL Cluster before, but the fact of the matter
is that it works perfectly fine to use the thread pool in combination
with MySQL Cluster.

There is one limitation in the current thread pool implementation. The maximum
number of thread groups are 64. This limit was set since MySQL didn't scale
beyond this number using InnoDB in those days. NDB is a distributed engine,
so it works a bit differently for NDB compared to InnoDB. It would be possible
to make the integration of the thread pool and NDB a bit tighter. But even with
the current implementation NDB can be used perfectly fine with the thread pool.

The limit 64 means that it won't really be so useful to use the thread pool and
NDB in combination with MySQL servers that use more than 16 CPUs.
The graph above show how the thread pool compares to the performance of
MySQL Cluster 7.6 on a small MySQL Server. It loses 1-2% on low thread
counts, but it continues to deliver good results even when passing the 512 thread limit.

The graph below shows how MySQL Cluster 7.6.6 using the thread pool compares to
MySQL Cluster 7.5.9 without thread pool. We see the usual linear curve at
high concurrency for the thread pool, in this case however it is limited by
the 64 thread groups since the setup in this case have access to 30 CPUs using
one cluster connection. I did some experiments where I moved the limit of 64
up a bit (a minor change). The performance for most experiments has a
good setting with thread pool size set to 128 and in this case the performance
actually increases a small bit as the number of threads increase.


Tuesday, June 05, 2018

Colocated MySQL Server and NDB data nodes


Historically the advice for MySQL Cluster has been to not colocate
the MySQL Server and the NDB data node for scalable applications.

There are still reasons to apply this principle in scalable setups
where the application isn't close to the data.

But with MySQL Cluster 7.6 we have added a number of reasons why it
makes sense to colocate the MySQL Server and the NDB data node.

Internally in the NDB development we have had a debate about whether
to integrate the NDB data node inside the MySQL Server. The reasons
for this is that the MySQL Server will be closer to the data. The
argument against is that the NDB data node and the MySQL Server are
designed with different recovery models. NDB data nodes are failfast,
as soon as we find a fault that is not supposed to happen we will
crash the data node. The MySQL Server on the other hand tries to
stay up as much as possible since a crash of the MySQL Server brings
down the data accessibility. In NDB we always expect another data
node to have a synchronous replica, thus data is accessible even in
the case of a crash.

With MySQL Cluster 7.6 we have gotten the best of both worlds. We
can now communicate from the MySQL Server to a NDB data node using
a shared memory transporter. This means that communication goes
entirely through the memory of the machine, the communication between
a thread in the MySQL Server and a thread in the NDB data node
goes through memory and when a thread needs to wake up a thread a
mutex is used with a condition variable exactly as in the MySQL
Server. Still the NDB data node and the MySQL Server is separate
programs that can reside on machines independent of each other
and they can crash independently of each other.

So with the release of MySQL Cluster 7.6 it is possible to have
clusters with locality of reads. Already in MySQL Cluster 7.5 we
introduced the possibility to declare tables as being able to
read from all replicas (Read Backup feature). In addition we
introduced tables that can be fully replicated in MySQL Cluster 7.5.
In these fully replicated tables access to a table is always local
to the data node we are in.

In MySQL Cluster 7.6 we are introducing a shared memory transporter
for efficient communication between a colocated MySQL Server and
an NDB data node. In addition we are introducing the possibility
to declare location domain ids for all nodes in the cluster. This
means that we can ensure that reads always stays local to the
Availability Domain in an Oracle Cloud (Availability Zone in Amazon
and Google clouds). Thus it is possible to design applications
without having to consider networking constraints as much as before
with NDB.

This means that we expect NDB to work very well in SQL applications.
We are also constantly working on improving the SQL performance of
NDB by supporting more and more push down of joins to the NDB data nodes.
We are working on improving the basic range scan mechanism in NDB,
we are working on improving the interface between the NDB storage
engine and the MySQL Server. Finally we are also working hard to
integrate all the changes in MySQL 8.0 into MySQL Cluster as well.

I will describe a number of different scenarios for how to build
applications in the cloud using a setup where we have 3 data nodes,
one in each availability domain of the Oracle Cloud.

But in this blog and a few more blogs I will start by looking
specifically at how the shared memory transporter improves performance
of standard sysbench benchmarks.

In the previous blog I showed how we have improved performance of
Sysbench OLTP RW even for the standard TCP transporter. This was
due to the use of a new wakeup thread and the use of locking the NDB API
receive thread to a CPU where it can work undisturbed. The receive
thread handles receive of all messages from the NDB data nodes and
must be prioritised over the other MySQL Server threads, the best way
to achieve this is to use CPU locking. In the benchmarks we present in
this blog we will always use this CPU locking.

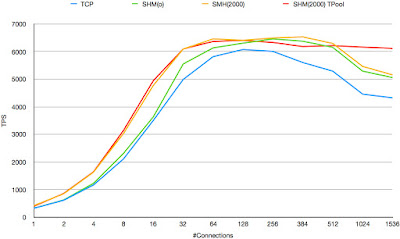
In the figure above we show how the performance of a normal setup using
7.5.9 compares to the 7.6.6 with receive thread locked to a CPU using
the TCP transporter. Next we have a curve that shows performance when
simply replacing the TCP transporter with a shared memory transporter.
Next we show a curve of what happens if we configure the shared memory
transporter to use spinning for a while before it goes to sleep.

The final curve shows the performance when also spinning in the TC
threads and the LDM threads in the NDB data node. Spinning in those
threads is not likely to be beneficial if those threads are not locked
to their own CPU core, thus in this one should not use hyperthreading
for those threads.

The takeaways from the graph above are the following:

1) The shared memory transporter have similar performance at low
concurrency as the TCP transporter. As concurrency increases the
shared memory transporter has better performance, the improvement
is 10% at top performance and more than 40% at very high concurrency.

2) Using spinning in the configuration of the shared memory transporter
improves performance at low concurrency significantly, by more than
20%. Top performance is similar to not using spinning, but it is
easier to get to this top performance.

3) Using spinning in the TC threads and LDM threads improves performance
even more at low concurrency. Performance increases by more than 30% at
low concurrency compared to no spinning and by 10% compared to spinning
only in transporter. Performance at high concurrency is similar for all
variants using shared memory transporter. So spinning helps to make the
MySQL Server need less concurrency to reach high performance levels.

We have added a graph below where highlight the performance at 1 and 2
threads since it is difficult to see those differences in the first
figure.

Configuring NDB to use a shared memory transporter is easy, the easiest
way is to simply set a new configuration variable UseShm to 1 on the
NDB data nodes. With this setting we will create a shared memory transporter
between all API nodes and this node when the API node and the data node
share the same hostname. It is also possible to create a separate shared
memory section to describe the transporter setup between two specific
nodes in the cluster.

Spintime for the shared memory transporter is easiest to setup using the default
shared memory transporter section. Spintime for TC and LDM threads in the NDB
data nodes are configured using the ThreadConfig variable in NDB data nodes.

Since we are using mutex and condition variables in shared memory we are
only supporting shared memory transporters on Linux at the moment.

The conclusion is that using the shared memory transporter we can improve
performance at low concurrency by more than 30%, we can improve throughput
by 20% and at very high concurrency (1536 threads) we get about 100%
improvement, all comparing to the result in using 7.5.9.

In the graph below we show only the 7.5.9 curve and compare it to the curve
achieved with all improvements in 7.6.


Monday, June 04, 2018

Improvements from NDB wakeup threads


In MySQL Cluster 7.6 we introduced a new thread type in the NDB API.
Traditionally each cluster connection has one send thread to assist in sending messages to NDB, a receive thread that can
assist in receiving messages from NDB.
There is also a connection thread that listens to new connections and connects to the NDB data nodes.

There is also a set of user threads that is created by the application
that uses the NDB cluster connection.

Most of the sending is done by the user threads, the NDB API sending
thread is only used only when we are sending faster than the network
is able to handle.

We can process receive messages in the user threads or in the NDB
API receive thread. The default behaviour is to use the user threads
until the concurrency is higher than 8 threads working at the same
time. So at the highest concurrency it is the receive thread that
handles the signals and at low concurrency it is handled directly
by the NDB API user threads. The 8 is configurable through the
MySQL server variable ndb_recv_thread_activation_threshold.

Receiving in the NDB API is slightly faster to use from user threads
when only one thread is active.  It is 3-4% better response time in
this particular case. However as more and more threads are sending
data to the NDB data nodes the efficiency of using the NDB API
receive thread increases.

One problem in using the NDB API receive thread is that it is responsible
to both receive the messages from the NDB data nodes and to wake up the
NDB API user threads. At low load this is not an issue. But when the
load on the NDB API receive thread reaches 90% and beyond, this becomes
an issue.

To avoid this problem we added a new thread in the NDB API in MySQL Cluster 7.6.
This is the wakeup thread. This thread only has one duty, this is to wakeup
other threads. We experimented with a number of different variants to see which
ensured that user threads are woken up as quickly as possible.

Our conclusion was that at low load the optimal is that the receive thread
handles the wakeup, but at very high load it requires assistance from one
wakeup thread. As load increases the receive thread will handle less and less
wakeups. At 99-100% load the receive thread will more or less offload all
wakeup calls to the wakeup thread.

In the figure above we compare a normal sysbench OLTP RW experiment
comparing 7.5.9 with 7.6.6. As can be seen there is no difference until
we reach 32 connections. As we start to offload a subset of the wakeups
to the wakeup thread we improve performance of the application.

The throughput increases 5% due to this new feature, with even more
threads the performance drops slower such that we gain 15-20% more
performance at 512 connections.

The best performance is normally achieved by using the NDB API
receive thread and that this thread is locked to a specific CPU.
When starting the MySQL server one specifies these CPUs in the
configuration parameter ndb_recv_thread_cpu_mask. If the MySQL
Server uses several NDB cluster connections, the parameter
should specify one CPU per cluster connection.

If locking the NDB API receive thread to a CPU, it is important to
also lock the MySQL server process to other CPUs and if other processes
are running on the same machine, these also need to be locked to
CPUs not interfering with the NDB API receive thread.

The figures above shows the improvements when using one of the CPU
cores locked to handle the NDB API receive thread. Locking the receive
thread to a CPU adds another 5% to the total throughput and up to
20% more at high thread counts.

So what we have achieved with MySQL Cluster 7.6 is that we can increase
the throughput by at least 10% and performance at high thread counts
can increase by as much as 40%. All these numbers are still using the
TCP transporter. In a coming blog we will show how these numbers increase
even more when using the shared memory transporter. In addition we will
show how using the thread pool with NDB can even further increase stability
of high throughputs at high thread counts.

The above experiment was always done with one data node using 8 LDM
threads, the data node is locked to CPUs within one CPU socket. The
MySQL Server is locked to using 30 CPUs (15 CPU cores). In all cases
the bottleneck is that we only use one cluster connection. In 7.5.9 this
cluster connection scales to about 18 CPUs and with 7.6.6 it scales to
more than 20 CPUs. So using one cluster connection per 8 CPU cores is
usually appropriate.

Saturday, June 02, 2018

MySQL Cluster 7.6 future proof

MySQL Cluster 7.6 is designed to improve the restart times
for database sizes that MySQL Cluster 7.5 and earlier versions
support.

At the same time MySQL Cluster 7.6 is preparing for the innovations
in HW architecture. Between 2008 and 2012 I was heavily involved
in handling the previous change in HW architecture. This change
was the introduction of multi-core architectures. Between 2008 and
2012 we scaled the MySQL Server from 4 CPUs to 64 CPUs.
The NDB data nodes was scaled from 2 CPUs to more than 50 CPUs in
the same timeframe.

The next major shift in the HW architecture is the introduction of
persistent memory, this means that we will get persistent memory
accessible at the same level as DRAM. We don't know yet all
characteristics we will see on those persistent memories, but a
guestimate on what to expect are:

1) About 10x more memory per DIMM
2) About 4x cheaper memory
3) About 10x slower access to the memory compared to DRAM
4) Memory will be persistent and survive a restart of the machine

As an example of this development Intel announced Optane persistent memory
to be fully available in 2019. These memory DIMMs will be available in 512 GB
DIMMs. A modern 2-socket server of today comes equipped with about 512 GB
memory. A high-end server of 2019 will be able to be shipped with 6 TByte of
persistent memory and on top of that also 400 GByte of DRAM memory.

MySQL Cluster 7.5 and earlier versions have a good fit for the modern servers
of today. MySQL Cluster 7.6 brings a much improved recovery architecture that
will improve restart times by 4x using current database sizes.

At the same time MySQL Cluster 7.5 won't work very well with machines with
6 TByte machines. This is due to the use of full checkpoints, thus each
checkpoint will have to write 6 TBytes to disk.

Actually most every in-memory DBMS have the same issue, so all in-memory
DBMSs have to adapt to this new reality. MySQL Cluster leads the way here
by introducing partial checkpoints in MySQL Cluster 7.6. Even disk-based
DBMS will get a fair amount of issues to handle around checkpointing
when the page cache grows to multi-TByte sizes.

During development of partial checkpoints I analyzed the difference between
the method implemented in MySQL Cluster 7.6 and using a page cache. The
method used in MySQL Cluster 7.6 needed to write 100x less data to disk as
part of checkpoints.

To give you a feeling for the impact of the checkpointing times in MySQL
Cluster I will describe what will happen with full checkpoints using
a 6 TByte database size.

Assume that we will write 100 MByte per second to disk for checkpoints.
In this case it will take 60.000 seconds to perform a checkpoint. This
means 16 hours and 40 minutes.

Now assume we perform a checkpoint in MySQL Cluster 7.6. In 7.6 we only
need to checkpoint those partitions that have changed any data. We assume
that half of the partitions in the database haven't changed since the last
checkpoint. We assume that we have a fair amount of updates, but since
checkpoints happen with intervals of around a minute, it means that only
a small portion of the 6 TByte will be updated. A partial checkpoint will
always checkpoint at least one part in 2048. This means that the minimum
size of a checkpoint in this scenario would be 1.5 GByte. Thus the
checkpoint will take 15 seconds in MySQL Cluster 7.6.

This means that the checkpoint time has decreased by a factor of 4000x
in this particular case.

The choice of the factor 2048 is to ensure that we can maintain very short
checkpoint times all the way up to memories of 16 TByte and even beyond this
it will still function very well.

Thus MySQL Cluster 7.6 is already prepared for the next generation of
HW architectures arriving in 2019.

As part of a node restart we perform a checkpoint and have to wait for the
previous checkpoint to complete. From this we can deduce that the improvement
of restart times is even bigger as we go towards bigger memories.

Friday, June 01, 2018

MySQL Cluster 7.6 in numbers

MySQL Cluster 7.6 is now released as GA. 7.6 contains a lot of interesting changes.
Here is a list of changes in numbers in the recent MySQL Cluster versions.

1) With the new changes of our checkpointing scheme the restart times in MySQL
Cluster are 3-4x faster for a database size of around 60 GByte.

2) The changes we have done in our parallel query execution parts have improved
some benchmark queries we have tested with up to a factor of 2.

3) A new wakeup threads in the NDB API means that each API node can deliver 10%
more throughput.

4) 7.6.6 introduces a new shared memory transporter to communicate between
colocated MySQL Server and NDB data nodes. This improves throughput by 10% and
can improve throughput on low thread counts as much as 60%.

5) Benchmarks using the Read Backup feature (released in 7.5) shows that
performance increases around 50% even in a network with a very high bandwidth.

6) A benchmark in the Oracle Cloud using the new feature to ensure locality of
reads within the same availability domain shows 50% improved throughput.

7) Parallelisation of the UNDO log applier speeds up this phase of the NDB recovery
by a factor of 5.

8) We have changed the defaults for index build during restarts that can speed up
the index build phase of the restart by a factor of 2.

9) We have changed the default batch sizes of index builds during restore of a
backup that can speed up restore by at least a factor of 2.

So as these numbers reflect MySQL Cluster 7.6 have significantly improved our
availability by decreasing the amount of time to restart a node. At the same
time we have also significantly improved performance of an SQL application
on top of MySQL Cluster using Read Backup feature, Fully Replicated feature,
a new shared memory transporter, a new feature for locality of reads in a
cloud environment and finally an improved throughput on each API node.

I will present those results in detail in the coming weeks. Some of those tests
was performed in the Oracle Cloud which means that anyone can reproduce the
exact same tests themselves which I think is a very nice feature with the
cloud.

Tuesday, May 01, 2018

Linux configuration for MySQL Cluster

NDB Cluster was designed from the ground up for real-time operations.
It has its origins in the telecom industry where predictability of performance
and latency is absolutely critical. In addition the telecom vendors are
competing very much on pricing of their product.

This leads to that it is important to get the most performance from each
telecom server. Increasing the performance by 10% means that you need 10%
less network equipment. If many servers are shipped this can be a substantial
cost that is worth spending valuable engineering time to achieve.

Thus if you are using or are planning to MySQL Cluster on many servers it
is a good idea to spend some time ensuring that one achieves optimal
performance. If you are operating MySQL Cluster in just a few servers the
payback on your time investment might not be as high.

Another reason to take a deep interest in performance of MySQL Cluster is
of course that you want to learn more about Linux and MySQL Cluster.

In this blog post I will mainly discuss one specific optimisation that can have
large impact on your performance. This is placing the execution threads of
MySQL Cluster and Linux on to the proper CPUs.

In my book MySQL Cluster 7.5 inside and out I devote 3 chapters to this
topic. One chapter on the usage of hyperthreading in data nodes, one
chapter on configuration of CPU locking for data nodes in NDB and
one chapter on configuring Linux interrupt handling.

In this blog post I will mainly discuss the Linux configuration.

NDB is a distributed DBMS where all operations pass through the network,
thus network operations is an essential part of the setup of a MySQL Cluster.

So how does a network packet arrive from the wire into MySQL Cluster and
out again.

The first thing that happens is that the network card receives a packet. It now
needs to inform a CPU about this packet such that Linux TCP/IP code can
handle the packet.

Now the Linux TCP/IP is divided into 3 parts. The first part is handling the
HW interrupt from the network card, the second part is handling the
soft interrupt. The final part is a function call interrupt from the soft interrupt
to the device driver to handle most of the interrupt handling.

The function call interrupt part was introduced in Linux 2.6.35, thus in older
Linux kernels this concept doesn't exist.

Modern Linux kernels also use the NAPI mechanism, this means that the
HW interrupt is disabled during the time we process a set of HW interrupts.
This mechanisms avoids overloading the CPUs with interrupt handling and
takes care of interrupts in batches at high load.

Now Linux interrupt setup is highly configurable and the defaults depends
among other things on the Linux distribution.

There are three main areas that can be configured for Linux. These are
RSS (Receive Side Scaling), RPS (Receive Packet Steering) and
RFS (Receive Flow Steering).

RSS handles setup of the HW interrupt and the soft interrupt. Often the
default is to spread these interrupts on all CPUs. This is usually not a
good idea for MySQL Cluster since some of the CPUs we want to
protect as much as possible from all OS activity (these are in particular
the LDM threads).

RPS is the new mechanism introduced in Linux 2.6.35 and one can configure
the CPUs where the function call interrupts are handled.

Finally RFS tries to ensure that the function call interrupt is executed
on the same CPUs where the application calls recv from. In NDB data nodes
this happens in the recv threads. In a MySQL Server the communication
from the data nodes arrives in the NDB API receive threads (this can be
configured to be locked to a specific CPU). The communication from MySQL
clients arrive in the connection thread where they are executed, so these are
spread on all CPUs the MySQL server is executing on.

When the NDB data node has processed the messages arriving on the network
it will send some responses onto the network. In the NDB data nodes this
happens either in all the threads or it happens in a send thread or a combination
of the two.

Linux has the possibility to configure transmit interrupts as well through
something called XPS (Transmit Packet Steering). The optimal behaviour is
achieved if the transmit interrupts are handled by the same CPU as the send
call is done from.

Configuring Linux and MySQL Cluster together can have a major positive
impact on performance. To achieve the best performance it is important to
consider the flow of data through the servers to process the database requests
from NDB clients (e.g. the MySQL Server).